

There are a few data points that I like to follow quite often in crypto, mainly to see where the momentum is, and where it is not. This article will simply be a few lists of figures/stats that I find interesting to know.
The reference for the prices in this article is October 1, 2023. The current price of $BTC is $27200 and of $ETH is $1690. Crypto TOTAL1 (total market cap) is $1065bn.
Best performers since their 2022 lows :
(Price increase of coins between their own 2022 price bottom and now.)
Among the largest market cap tokens :
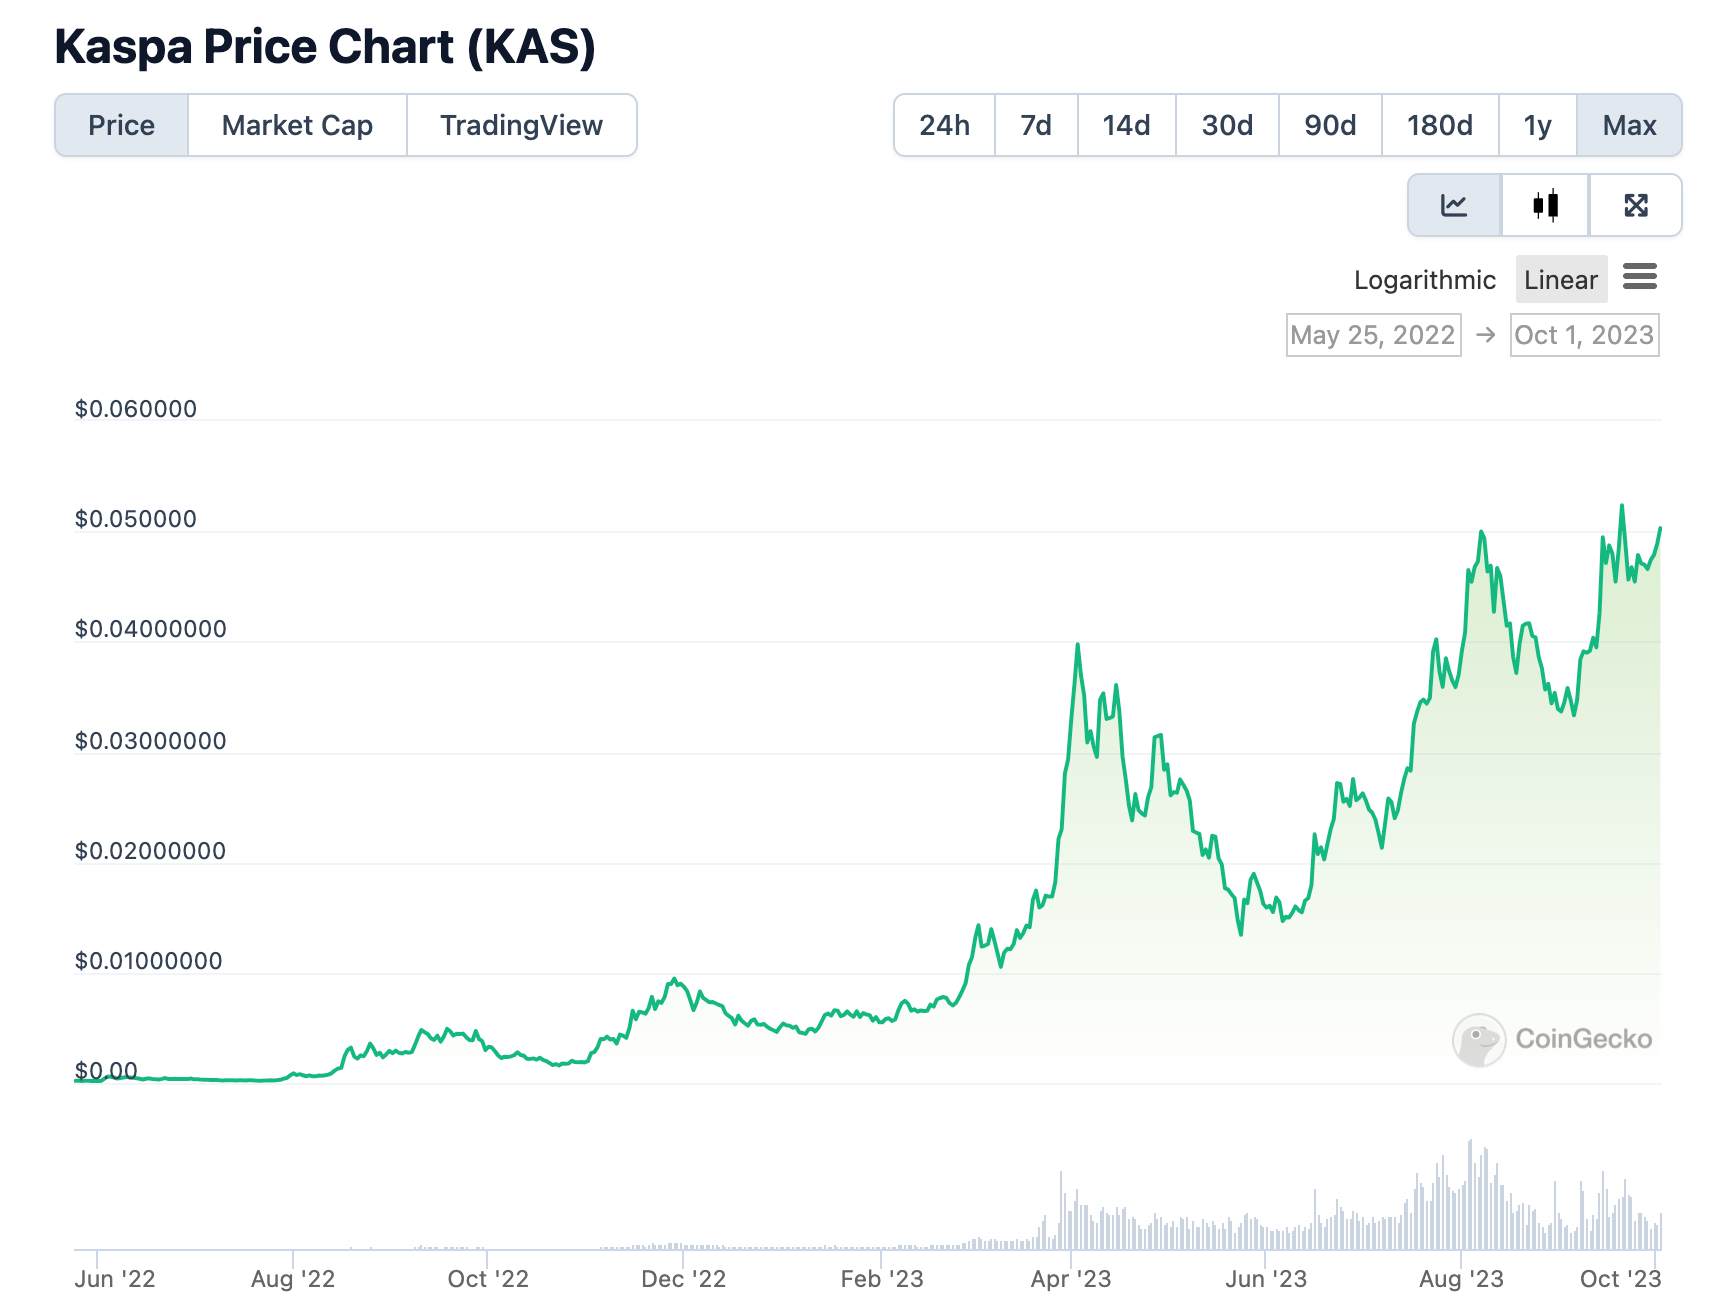
$KAS : +25000%
$RLB : +12200%
$INJ : +570%
$CFX : +500%
$RNDR : +400%
$OKB : +330%
$LDO : +280%
$WEMIX : +270%
$GMX : +210%
$MKR : +210%
$OP : +210%
$OCEAN : +190%
$BCH : +170%
Among smaller market cap tokens :
$VELA : +4300%
$PENDLE : +2100%
$RDNT : +2100%
$GNS : +520%
$TRB : +500%
$AGIX : +440%
$GRAIL : +390%
$AKT : +360%
$SSV : +320%
$FET : +320%
$FLOKI : +250%
$BLZ : +220%
$RPL : +180%
Comment : this data is important to have a good idea of the coins that have long-term momentum. It is a very good sign if a token has performed well from its 2022 bottom, because it show that there is an actual demand. But you must also be aware that some might simply be mean reverting after an overextended dump, and some are coins that have massively benefitted from a narrative that might not be long-standing. For example, some AI coins did perform very well, but they won’t necessarily be good long-term bets in my opinion (AGIX, FET).
Worst performers since their 2022 lows :
Among the largest market cap tokens :
$HEX : -81%
$LUNA : -61%
$CAKE : -56%
$APE : -54%
$HT : -40%
$KDA : -39%
$ALGO : -34%
$FLOW : -28%
$CHZ : -27%
$EOS : -27%
$GMT : -26%
Additional info for smaller projects :
$OSMO : -53%
$SUSHI : -34%
$RSR : -27%
$1INCH : -27%
$AR : -27%
These are the coins that you might want to stay away from. Printing new all time lows is really negative, and the crypto market is very unforgiving : you can dump -90% after a -90%, and then still continue to dump. Maybe some of them are actually at attractive discounted price, but it is more risky to buy them than to but coins that have had some momentum.
Best-performers in the last 30 days :
In the top 100 :
$WEMIX : +88%
$WLD : +54%
$KAS : +47%
$LINK : +36%
$MKR : +36%
$AAVE : +27%
$RUNE : +24%
$GMX : +23%
$HOOK : +22%
$LUNA : +22%
$TON : +22%
$KCS : +21%
$RNDR : +21%
$COMP : +18%
$CRV : +17%
$EDU : +16%
$TRX : +16%
$BCH : +16%
$SOL : +15%
Comment : Most coins here are lone wolves in terms of narratives and pumps, but we can see that strong projects from the previous bear market are performing very well : $LINK, $MKR, $AAVE, $RUNE and $COMP.
Best performers in the last 90 days :
Among the largest market cap tokens :
$RLB : +276%
$CYBER : +197%
$KAS : +116%
$RUNE : +82%
$MKR : +74%
$XDC : +62%
$WEMIX : +57%
$TON : +47%
$LINK : +24%
$SOL : +18%
$TRX : +15%
$XRP : +8%
$XLM : +7%
$WLD : +3%
$OP : +2%
Coins that are the closest to their ATH price :
Among the largest market cap tokens :
$KAS : -2%
$OKB : -25%
$RLB : -41%
$ARB : -46%
$GMX : -63%
$TON : -53%
$SEI : -55%
$OP : -57%
$TRX : -60%
$BTC : -61%
$INJ : -64%
$ETH : -66%
$SUI : -68%
$BNB : -68%
$XMR : -69%
Among smaller market cap tokens :
$ATOR : -16%
$SDEX : -30%
$LEVER : -44%
$RDNT : -48%
$PRIME : -50%
$BITCOIN : -54%
$TRB : -56%
$KUJI : -61%
$RPL : -63%
And a few even smaller ones :
$DUBBZ : -24%
$STFX : -34%
$HILO : -36%
$ACX : -38%
I like to keep an eye on this information, because the coins that are close to their ATH price are usually coins that have momentum and that have a higher chance of continuing their trend. In the same time, a coin that is not too far from its ATH price is usually a new coin, with a clean chart, and it can go into price discovery, which is where the really wild crypto pumps are happening. These are the tokens that are most likely to outperform. You don’t want to have a portfolio where all of the coins are down -90% from their ATH.
A few data points for major existing alt L1s and L2s :
Distance from their ATH price :
$ARB : -46% (+86% needed to get back to ATH)
$OP : -57% (+132%)
$SUI : -67% (+210%)
$BNB : -68% (+215%)
$APT : -72% (+260%)
$MATIC : -81% (+422%)
$ATOM : -83% (+500%)
$ADA : -91% (+1080%)
$SOL : -91% (+1030%)
$DOT : -92% (+1200%)
$AVAX : -93% (+1300%)
Seeing the percentage of gains needed to get back to ATH price is a better way to see the difference between for example a -70% and a -85%…
Gains from their 2022 lows :
$OP : +207%
$SOL : +140%
$APT : +75%
$MATIC : +59%
$ATOM : +22%
$BNB : +11%
$ADA : +7%
$DOT : -3%
$AVAX : -9%
FDV of these coins :
$BNB : $35.6bn
$ADA : $11.8bn
$SOL : $11.7bn
$ARB : $9.5bn
$OP : $5.9bn
$APT : $5.6bn
$MATIC : $5.6bn
$DOT : $5.1bn
$SUI : $4.8bn
$AVAX : $3.8bn
$ATOM : $2.1bn
Comments :
From the data I read here, and from my own bias perception about each coin, I would not want to buy : $BNB (market cap is still huge, so there’s a lot of downside, especially with the current Binance FUD, and not much upside), $ADA (no momentum, still a very high FDV for a network that not many people use…), $DOT and $AVAX (these two are printing new lows, they don’t look very trendy anymore, bagholders see their conviction being shaken every new day), $APT and $SUI (almost no activity on networks that will have a lot of selling pressure from early investors… but they might have some hated rallies).
The current FDV of $OP + APT + $ARB + $SUI is $26bn, and most of that is unlocked, and is equivalent to the total (liquid) market cap of $SOL + $DOT + $MATIC + $AVAX + $ATOM which is around $23bn.